|
Executive Summary
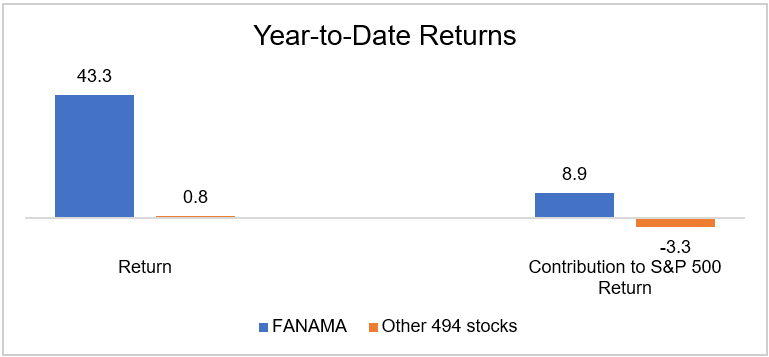
- The S&P 500 returned 8.9% in Q3 2020 marking the second strong quarter in a row for the stock market. Together, Q2 and Q3 represent a sharp recovery from the stock market’s steep drop in Q1 2020, year-to-date (YTD) returns are 5.6% for US stocks and 1.8% for global stocks.
- The return of the average US stock was significantly lower than that of the capitalization-weighted S&P 500 index due to the narrowness of the market’s recovery and the disparity in returns across sectors and styles that may cause individual investors to be more dissatisfied than summary-level market performance might suggest is appropriate.
- Although the stock market has bounced back quickly, the damage to the US economy and how long it is likely to take to recover should not be underestimated.
- Investors can expect continued market volatility at least until the US elections are resolved and probably not until there is a clear line-of-sight as to when a vaccine is likely to be broadly available and in demand. The timing of if-and-when market leadership will shift from defensive pandemic stocks to post-pandemic recovery stocks is uncertain though unlikely to occur before midyear 2021 and the profoundly different policy implications depending on the outcome of the US election. Investors should be careful not to make any assumptions about how the market will react to the result of the US election –whatever they may be – and to keep in mind that the economy and the stock market can prosper under Democratic, Republican and split control of the branches of government.
- In response to the overhang of lost jobs and small business failures, the Federal Reserve (Fed) has communicated that it is likely to keep interest rates low for the foreseeable future by targeting an average interest rate (to be calculated using an unspecified window of time). The low absolute level of interest rates and therefore low expected return for the fixed income portion of balanced portfolios means investors and their advisors need to be thoughtful about the return assumptions used in constructing their financial plans and open-minded to risk management strategies beyond bonds, providing an opportunity for financial advisors to be particularly helpful to investors in the years ahead.
A handful of companies provide another strong quarter for the S&P 500
After a strong stock market rebound in Q2 from its low point in Q1, the US stock market’s rebound continues to be driven by six stocks of five large-cap growth companies, popularly known as the FANAMA (Facebook, Apple, Netflix, Amazon, Microsoft and two share classes of Alphabet (aka Google)). The stocks of these five large-cap growth companies enjoyed a YTD return of 43.3% while the stocks of the 495 other companies in the S&P 500 returned a mere 0.8% for the same period. The FANAMA stocks carry a higher P/E multiple because the growth of their earnings is either insulated from, or benefits from, the impact of social-distancing prompted by the coronavirus pandemic. Their low debt ratios also make these companies less risky during a recession.
Source: FactSet
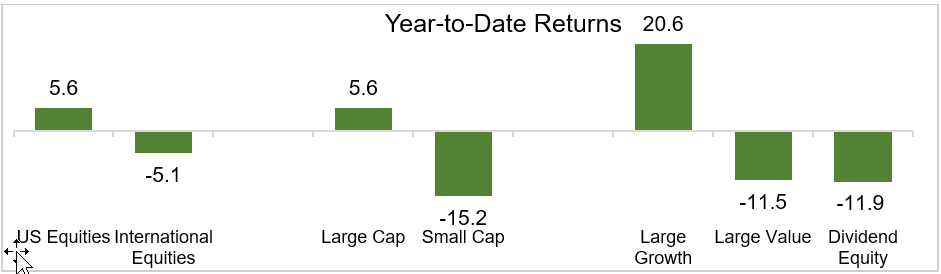
The handful of large-cap US growth stocks that drove the return of the S&P 500 mean than any diversification outside the U.S., growth, or large-cap has hurt investor performance year-to-date. In contrast to the 5.6% return YTD of the S&P 500, international stocks returned -5.1% because information technology, which was the single best-performing sector, represents a much larger percentage of the S&P 500 than international stock markets. The exposure to technology in the US index is over double the weight it represents in the international index. Similarly, the financial sector, which was one of the worst-performing sectors, represents a larger percentage of the market-cap of international markets than of the S&P 500. International index exposure to financials is just shy of double that of the US index exposure. (Note: the underperformance of value across managers will vary depending on the definition of value used by each manager) U.S dividend stocks1 returned -11.9% YTD and the S&P 500 Value index returned -11.5% for the same period This means that year-to-date performance of the value stocks in the S&P 500 are a full 17 percentage points below that of the most commonly reported broad market index. Small-cap stock performance also lagged that of large-cap stocks returning -15.3%.2
Source: Morningstar. S&P indices used for domestic markets, MSCI index represents international markets, see endnotes for details3
Market vulnerable to volatility given weak economy and unprecedented uncertainty
GDP growth in Q3 is expected to be more than 30%. Investors, however, should keep in mind that even after Q3 growth, the GDP will still not be back to where it began 2020 and growth is likely to be positive, but dramatically slower in Q4.
Investors are often cautioned to remember that the economy is not the market. While this is true, they are related. Although the US economy has regained many of the jobs it shed in the first and second quarter of this year, the pace of rehiring and new job creation is slowing even as job losses continue. The US unemployment rate is currently 7.9%. While this reflects considerable progress from the record high number of jobs lost in March and April this year, it is still more than double the level of unemployment pre-pandemic. Even if the economy were to add 800,000 jobs a month, (the consensus estimate for September that the economy failed to achieve), getting unemployment back to pre-pandemic levels is still likely to take several years. It is important to recognize that the job losses resulting from the pandemic are probably not over, with airlines and hotels recently announcing new layoffs and furloughs, declines in government payrolls and the loss of temporary jobs created in connection with the 2020 Census.4 The need for more assistance from the federal government seems clear and yet the US Senate is unlikely to pass even a “skinny” version of an extension of coronavirus assistance.
Add to this uninspiring macroeconomic backdrop an unprecedented level of uncertainty concerning the pandemic and the US election, and it would not be surprising if the markets continue to see elevated volatility with the potential for pull-backs. This state will certainly hold true until the US election in November, which would be typical for any presidential election year, but may continue into 2021 if the election results are contested. Finally, although the news to-date on vaccine research has been promising, new updates on the vaccines and the course of the pandemic will likely continue to influence markets until there is a clear line-of-sight to the broad availability and adoption of a vaccine, which will likely be in the second half of 2021.
Despite the risk of emotional contagion between politics and investing, whether Democrats or Republicans win the White House does not usually have any long-term impact on the stock market which has been able to do well, under both parties. However, the fiscal policy implications of a sweep of both the White House and the Senate this election by one party or the other might have a significant impact on markets.
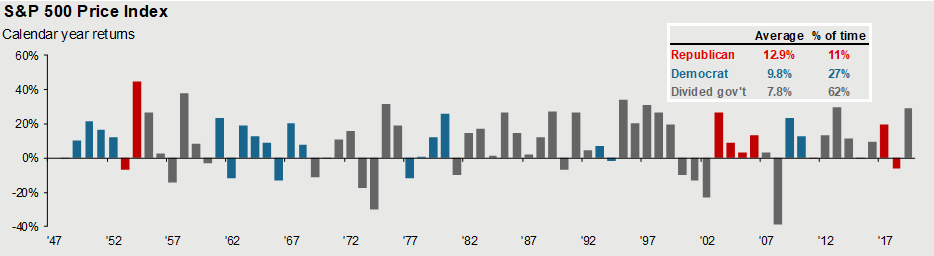
Source: JPMorgan – “Guide to the Markets Q4 2020”
The Republican legislative agenda is likely to be viewed by investors to be an extension of what they worked on during their first four years. One of the most frequently cited implications, if the Democrats win the White House and the Senate, while retaining the House of Representatives, is a likely increase in the corporate tax rate from 21% to 28%. Although 28% would still be significantly below the 35% nominal rate in place before the 2017 Tax Cut and Jobs Act, a higher corporate tax rate, by itself, would reduce corporate earnings and therefore stock prices (although the effective tax increase is likely to be less than the nominal increase might suggest and will affect different industries differently). Having said this, investors are cautioned not to make decisions based on how they assume the market will react to the election results. The biggest driver of the market this year has been monetary policy which is unlikely to be materially different under a Democratic, Republican, or divided government. Equally important as tax rates to the market, will be how any tax revenues are used. To the extent higher corporate taxes are used to finance high-impact fiscal stimulus, the net impact on corporate earnings might not be materially negative and might even be positive for earnings and stock prices, especially if trade restrictions are lessened, or if likely adoption of a vaccine increases, allowing more businesses to re-open. The regulatory priorities of the two parties are another complex issue whose impact on earnings and stock prices can be difficult to estimate in isolation, as they may create offsetting challenges or benefits at the same time they increase or reduce the cost of doing business. For example, increased regulation of technology companies may make it more difficult for large companies to protect themselves by buying emerging competitors, but it may also allow for faster growth of innovative new companies with emerging technologies. I do not mean to argue for or against any particular policy agenda, only to point out that the market assessment of such policy differences is generally more comprehensive and better-informed than any decision informed solely by any individual investor’s political philosophy.
Low interest rates challenge financial planning and risk management
In March of this year, the Fed reduced short-term interest rates to near zero and began an aggressive bond-buying program that flattened the Treasury yield curve such that the 10-year Treasury bond currently yields only 0.70%. This low-rate environment is likely to remain with us longer than market analysts might have originally assumed, given a late August announcement by Fed Chairman Jay Powell that, in a change of policy, the Fed would switch from targeting a constant inflation rate of 2% to targeting an average inflation rate (to be calculated over an unspecified period) of 2%. The change means that the Fed is likely to allow inflation to go above 2% for quarters at a time without raising interest rates. The idea is that given high unemployment and a struggling economy, the Fed plans to prioritize employment and economic growth over price stability (inflation) until the economy is on a firmer footing.
The low absolute-level of interest rates, while stimulative for the economy, poses a challenge to bond investors. Over the past 20 years, falling interest rates have significantly enhanced the total return of bonds and provided a portfolio hedge for the risk of recession (the basis of the hedge is that in the event of a recession, the Fed will cut rates to stimulate growth, boosting the price and total return of bonds in the process). In addition, the past 20 years of interest rate history are an aberration, having started the period with Fed Funds at 20% when the Fed was trying to bring inflation under control and then steadily brought down rates along with inflation for the next two decades.
When developing an investment strategy to help deliver on investors’ financial goals, advisors may adopt return assumptions based on historical average annual returns for stocks and bonds over the past 20 years. While 20 years may sound like a long time, the 20 years prior to this year captures only the back half of the interest-rate cycle and is an aberration since it begins in 1980, when the Fed was trying to rein-in inflation and had hiked the Fed Funds rate to 20%. The 10-year Treasury yield began its decline from its peak in 1981, when it yielded 15.82%, to its current yield of approximately 0.70%. Prior to 1980, the long-term average annual return for US government bonds was 2.8%, contributing to the 7.6% average annual return on a 60/40 stock/bond portfolio. Given how low government bond yields are today, even a 2.8% average annual return assumption for bonds for the next two decades may seem optimistic to many.
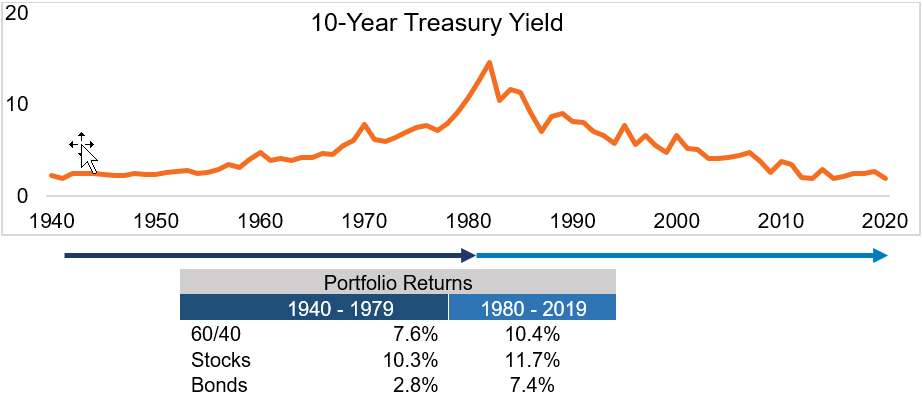
Source: Yale/Shiller (10-year Treasury). Wealth of Common Sense – “Can the 60/40 portfolio still work?’ 60/40 portfolio represented by 60% S&P 500 and 40% 10-year Treasuries. Stocks represented by S&amo;P 500, Bonds represented by 10-year Treasuries
An important implication of the current low-rate environment is that bonds will be of limited value to hedge recession risk. Another implication is that it will be more challenging to achieve client financial goals within their tolerance for risk. In contrast to today, where investors look only at their emotional tolerance for withstanding short-term market losses, investors—with the help of their advisors—will need to thoughtfully balance their emotional tolerance for risk with the minimum risk required to achieve their financial goals, based on more current and realistic asset class return assumptions.
In addition, asset class diversification by itself may no longer be sufficient to manage portfolio risk, tactical strategies that can use active volatility management, tactical-trading short positions and derivatives may also be required for effective diversification. September returns provided a good example of how frustrating the search for diversification can be with international stocks, US stocks, REITs, bonds, and gold all posted negative returns for the month. Risk management may eventually mean that investors and advisors will consider low-volatility strategies regardless of asset class (e.g., covered call writing, and long-short relative value equity strategies) as a potential source of ballast and income in lieu of bonds.
These will likely require more robust and thoughtful financial planning than ever, longer and more engaging conversations between investors and their advisors, and underscores the need for investors to find advisors who can work with them on financial plans that are based on realistic return assumptions and who have the tools to help them manage risk beyond a simple mix of stocks and bonds. Deciding asset allocations based on investor risk appetite may mean that financial goals cannot be achieved—or worse—use overly optimistic historical returns assumptions that result in retirement funds being depleted prematurely. We believe that the future of risk-profiling for financial planning will be an iterative process with advisors helping investors understand not just risk tolerance, but also risk capacity and the minimally required risk to achieve financial goals. This heightens the investor need for an independent financial advisor and represents an opportunity for advisors to provide more value than ever for their clients. It also underscores the need for investors to find advisors who can work with them on financial plans that are based on realistic return assumptions and who have the tools necessary to help investors manage risk beyond the creation of a simple mix of stocks and bonds. At the same time, the growing importance of financial planning necessitated by low return assumptions for bonds creates an opportunity for advisors to have deeper engagement with clients and to offer them additional value.
We need to understand that we may be entering a fundamentally different investment environment where the old frameworks and rules-of-thumb will no longer be adequate. Investors planning for retirement will need the assistance of advisors and financial planners who can offer more than “common wisdom” and historical averages. They will need advisors with portfolio simulation tools and a portfolio diversification framework flexible enough to include low-volatility strategies beyond bonds.
|