|
In 2021, we saw global equity markets move solidly higher with nary a pullback to speak of. Unfortunately, 2022 started on a much more volatile note, with stock markets experiencing their first +10% corrections since the depths of the pandemic and the lockdown-induced recession of Q1 2020. US inflation hitting a 40-year high prompted the Federal Reserve (“the Fed”) to embark on a tightening cycle. Further complicating the 2022 outlook is the war in Ukraine, potentially amplifying price pressures and a US economy that is showing signs of slower growth ahead. Indeed, central banks in general, and the Fed in particular, have not had to walk such a policy tightrope for over a decade.
The challenge for the Fed is to balance its goals of promoting maximum employment and stable prices. Should the Fed be perceived as being too slow in taking away the monetary policy punchbowl (i.e., raising short-term rates and shrinking the size of their balance sheet), they run the risk of runaway inflationary expectations becoming embedded into the economy. Alternatively, should the Fed be perceived as draining liquidity too quickly, they risk tipping the economy into recession.
Markets Prepare for a Fed More Focused on Price Stability
Throughout the first quarter, the Fed was consistent in communicating they would begin to remove monetary accommodation in 2022. However, financial markets were somewhat caught off guard by the increasingly hawkish tone set by the Federal Open Market Committee (“the FOMC”) members during the quarter. The chart below shows how the Fed started the quarter projecting a Federal Funds Rate of less than one percent by the end of 2022, only to revise that to essentially two percent by the end of the quarter.
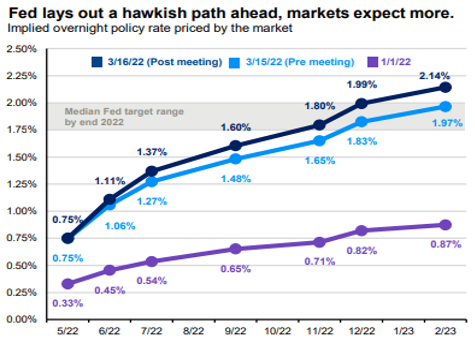
Chart 1. Implied overnight policy rate based upon market expectations
Source: JPMorgan Asset Management. Weekly Market Recap. March 21, 2022
Indeed, financial markets took note of the Fed’s change in tone in the first quarter. The US Ten Year Treasury yield surged 90 basis points to end the quarter at 2.3%. US investment-grade bonds fell more than stocks during the quarter, underscoring a key source of investor consternation. Since 1997, core bond returns have been a reliable diversifier to their more volatile equity market counterparts. When stocks have experienced significant corrections, core bonds typically cushion the blow to portfolios, allowing investors to remain focused on their long-term goals. Given the first quarter’s seemingly perplexing returns, investors must wonder if a return to a high-inflation and low-growth environment (e.g., 1970s style stagflation) is waiting in the wings.
Focusing on Price Stability Doesn’t Automatically Mean Growth Instability
Investors need to be especially cognizant of three elements of inflation:
- Lack of Familiarity. Except for some brief spurts prior to the Tech Bubble of 2000 and the Great Recession of 2008, investors, by and large, have not had to deal with any broad-based rise in inflation since the 1970s.
- Visibility. Investors are being reminded of inflation most everywhere. It is not just in asset prices (i.e., housing, stocks). Rather, it is apparent every time we fill our cars at the gas pump or visit the grocery store to buy a loaf of bread.
- Inflation is a lagging economic indicator. The Conference Board1 publishes three groups of proprietary economic indicators monthly: leading, coincident, and lagging. The goal is for cyclical turning points in the Leading Economic Index® (LEI) to occur prior to those in the economy, cyclical turning points in the coincident index to occur at about the same time as those in the economy, and cyclical turning points in the lagging index to occur after those in the economy. Of the three indicators, only the lagging index contains price/inflation components (e.g., labor cost per unit of output for manufacturing, consumer price index for services).
This is not to say investors should ignore current inflation readings. Clearly, core bond markets (whose coupon payments do not have an inflation hedge or growth component such as company earnings) face significant headwinds. However, for equities, it is about when these higher prices impact consumer and corporate behavior. For example, at what point will higher material costs and wages eat into profit margins? Or when will soaring gas and food prices force families to cut back or eliminate other spending? Said differently, when will inflation cause growth to slow, and slow to the extent that it threatens stock market returns?
To gauge these trade-offs, the following chart looks at the six-month growth rate in the Conference Board’s LEI. While it has come off its peak, the recent round resembles the post-2009 period rather than the deterioration that preceded 2008.
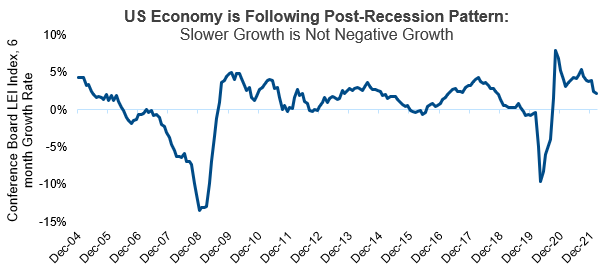
Chart 2. Conference Board Leading Economic Indicator Index, 6-month Growth Rate
Source: Bloomberg
What About the Fed?
The combination of a slowing LEI and the Fed announcing a significant reduction in monetary accommodation has understandably unnerved investors. But is a “Fed policy error” (i.e., inducing a recession) a foregone conclusion?
To gauge this concern, consider one of the components of the LEI: the US yield curve. The following chart looks at the US Treasury yield curve and how its shape morphed during the first quarter as “Fedspeak” became increasingly hawkish. Not only did interest rates rise across the maturity spectrum, but note how its shape flattened, especially from year two and further out. In fact, more recently, the “10s/2s” curve—the difference in yields between the 10-year and 2-year Treasury bond—has slightly inverted, meaning investors are demanding a higher yield on a two-year bond than the 10-year note. While this is not the interest rate spread used in the LEI (which is the difference between the 10-year note and Fed Funds rate), the expectation may be that with the Fed set to increase the Fed Funds rate by at least another 150 basis points in 2022 (and to continue into 2023), it is only a matter of time before the entire curve inverts.
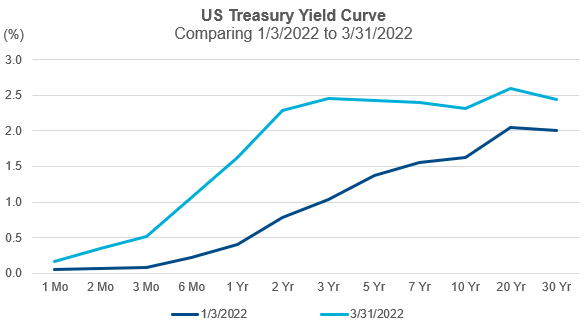
Chart 3. US Treasury Yield Curvee
Source: FactSet
For investors, the issue is yield curve inversions have reliably preceded economic recessions, and recessions have historically delineated deep corrections from bear markets. In fact, in the last 50 years, recession-driven bear markets had an average decline of nearly 33% and an average length of over 17 months, while non-recession deep corrections had an average decline of 18%, with an average duration of just under seven months.2
So, while risks are rising, it is imprudent to get too far ahead of oneself in terms of making changes to portfolios. Even if the Fed does induce a more widespread yield curve inversion, yield curve inversions have historically had a variable lead time of between six and 24 months to recessions. From an equity market perspective, looking back at the last seven times the market inverted, the S&P 500 has risen five out of seven times on a three-, six-, and 12-month basis following the initial inversion. The average 12-month gain following a signal has been 11%.3
Fixed Income Outlook: Leaning into the Wind
As evidenced by the first-quarter results, central bank tightening cycles have historically proven to be a challenging market environment for government bonds. Given the Fed’s more aggressive stance, the playbook for fixed income remains somewhat unchanged from last quarter, with the caveat that forward-looking, long-term returns for government bonds have improved with the increase in yields.
In the current environment, page one of the fixed income playbook is a reminder the bond market is more than just government bonds. Non-core bonds, such as high-yield bonds, provide additional sources of income. As Chart Four shows, high-yield credit spreads have substantially tightened since 2020’s pandemic lows and remain narrow. However, with additional yield comes additional risk, as high-yield spreads widened in the first quarter. Those spreads never reached levels that have historically indicated a “credit crunch” was underway. In fact, credit spreads have narrowed slightly from their widest points during the quarter. Credit conditions are another component of the LEI, and they, like the yield curve, appear to be sending the message that while risks have risen, it may be premature to hit the investing equivalent of the panic button just yet.
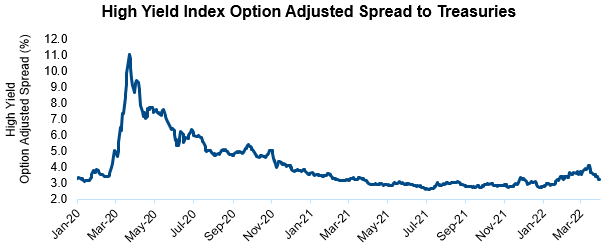
Chart 4. High yield credit spreads to Treasuries
Source: Bloomberg, Option Adjusted Spread on Bloomberg Corporate High Yield Index
Equity Market Outlook: Maintain Diversification and Discipline
Human tragedy and suffering notwithstanding, for investors, the war in Ukraine has added complexity to an equity market environment that was already coping with slowing growth and lower liquidity. While we have already discussed how the conflict in Ukraine has amplified energy and food price pressures, there also are implications for regional growth trajectories. For example, the US economy certainly looks to be more insulated than Europe. However, the US is still well above its average valuation for the last 25 years, while Europe is currently valued at, or below, its long-term averages. Furthermore, composition differences within regional equity markets are another factor to consider. For example, US averages tend to be more tilted towards growth-oriented stocks, while broad European indices lean towards value-oriented names, and historically, high-inflation regimes have favored value stocks.4
As mentioned previously, in the first quarter, equity markets experienced their deepest drawdown since 2020. Like the smaller pullbacks in Q3 and Q4 2021, Chart Five shows this correction was met with anything but investor complacency. Like the previous two instances, markets responded to the extreme pessimism by rallying strongly in the second half of March. This is exactly what a wall of worry looks like, and as long as this dynamic persists, it could continue to put a short-term floor under a stock market pullback or correction, despite the valid concerns regarding high inflation and hawkish central banks.
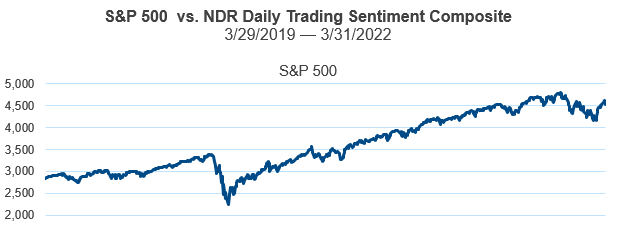
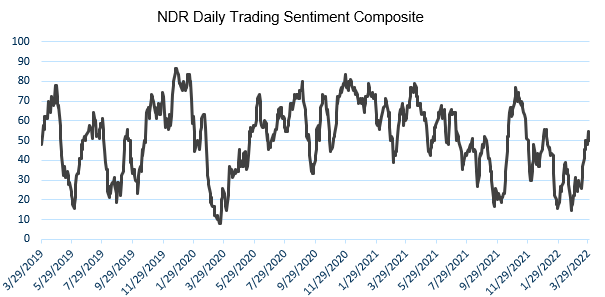
Chart 5. S&P 500 vs. NDR Daily Trading Sentiment Composite
Source: Ned Davis Research, Bloomberg
The NDR Daily Trading Sentiment Composite is a sentiment indicator designed to highlight short-term swings in investor psychology. It combines a number of individual indicators in order to represent the psychology of a broad array of investors to identify trading extremes that may be used for contra or hedging trades.
© Copyright 2022 NDR, Inc. Further distribution is prohibited without prior permission. All Rights Reserved.
Wrapping It Up
In 2020 and 2021, economies and markets benefitted from significant fiscal and monetary stimulus. However, in 2022, that tide is reversing, with central banks poised to start taking back much of the extraordinary accommodation provided during the pandemic. With inflation running at 40-year highs in the US, investors are looking to interest-rate-sensitive indicators, like the yield curve, to define whether the Fed will be able to successfully navigate the economy to a “soft landing.” While the risk of recession is increasing, investors would be well served to not front-run any potential outcome. Rather, maintaining an appropriate level of diversification across a range of asset classes and strategies and monitoring data that has been historically reliable in measuring trends during economic and market risks seems as relevant and prudent as ever.
Ask a question about Davin's update
View Q1 Market Update
|